Business credit demand sees moderate growth after slow start to 2016

Veda Quarterly Business Credit Demand Index: March 2016 quarter
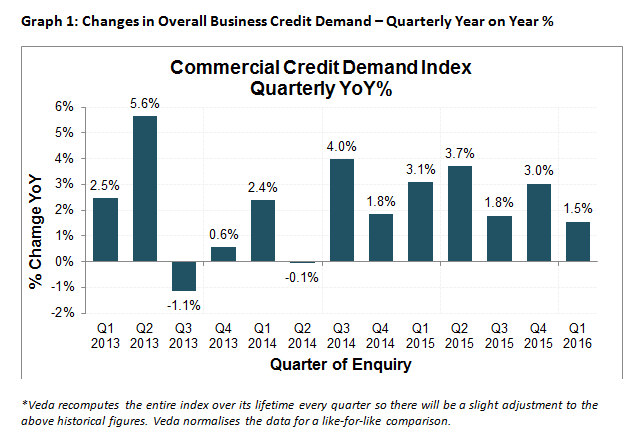
- Overall business credit applications rise +1.5% (vs March quarter 2015)
- Growth in asset finance (+3.3%) and business loan applications (+3.2%) slows (vs March quarter 2015)
- Annual rate of fall in trade credit applications eases to -1.7% (vs March quarter 2015)
Sydney, Australia, Wednesday, 13 April 2016: Released today, the Veda Quarterly Business Credit Demand Index, measuring applications for business loans, trade credit and asset finance, rose at an annual rate of 1.5% in the March 2016 quarter.
This outcome was softer than that seen in the December 2015 quarter, when the rate of growth was 3.0%. The decline in growth rate quarter-on-quarter was driven by slow growth in asset finance applications (+3.3%) and business loans (+3.2%), along with continued deterioration of trade credit applications (-1.7%).
The latest credit data also showed a continuation of the trend of weaker overall demand for business credit in the mining jurisdictions (-1.7%) compared with the non-mining jurisdictions (+3.1%).
The Veda Business Credit Demand Index has historically proven to be a lead indicator of how the overall economy is performing. Veda’s data indicates a slowing annual rate of growth in business credit applications which suggests caution around the economic outlook.
Given the historical relationship between the Veda Business Credit Demand Index and growth in real GDP, Veda’s latest business credit data for the March quarter indicates a slight easing of growth in the Australian economy from the 3.0% recorded in the December 2015 quarter.
Veda’s General Manager, Commercial and Property Solutions, Moses Samaha, said a significant cooling across all indicators in January had dragged down the entire quarter, despite more positive growth being seen in February and March.
“The considerable dip experienced across the board in January may have been impacted by media coverage reporting an anticipated global economic downturn, which led to poor global sentiment,” Mr Moses said.
“Locally, a major Australian retailer publicly announced that it had entered external administration in early January. The job losses and direct impact on trade creditors may have effected general business and consumer sentiment and contributed to the January downturn in business credit demand.
“The story is far more positive if we look exclusively at the annual growth rate in February and March, when it averaged 4.1%. Yet this bounce back was not enough to compensate for the poor start to the quarter,” he added.
Growth in overall business credit applications eased in the March quarter (+1.5%). Demand for business credit was strongest in NSW (+4.8%), followed by Tasmania (+3.7%), Victoria (+1.7%), the ACT (+0.2%) and SA (+0.1%). Overall business credit applications fell in all mining jurisdictions, led by the NT (-14.0%). WA (-3.5%) and Queensland (-0.3%) also recorded falls.
Business loan application growth slowed in the March quarter (+3.2%). Tasmania recorded the strongest rate of growth (+10.8%), followed by NSW (+6.2%), Victoria (+5.1%), the ACT (+2.4%). Queensland (+1.6%) was the only mining state to experience positive growth in business loan applications. The NT (-11.0%) saw the most significant fall in growth rate, followed by SA (-6.2%) and WA (-2.6%).
Within business loans, credit cards experienced strong growth (+13.6), while growth in lending proposals (+9.4%) also remained solid in the March quarter. However, mortgage applications (-1.2%) weakened for the third consecutive quarter and are now down considerably from an annual rate of growth of 21.4% recorded in the June quarter of 2015.
“There is a marked split between the positive growth of credit card applications and lending proposals, and the continued poor performance of commercial mortgage applications. The steep decrease in mortgage applications is certainly driving the overall slowdown in business loan application growth,” Mr Samaha said.
“The decline in commercial mortgage applications suggests an impact from both the tightening of conditions to construction/development applications and from the Australian Prudential Regulation Authority’s (APRA’s) policy changes, aimed at curbing lending to property investors, with the lowest growth rates seen in the March quarter for some time,” he added.
Trade credit applications continued to fall in the March quarter (-1.7%); however, the rate of decline has eased from the December 2015 quarter. Trade credit applications have recorded a fall over the past 12 months in Tasmania (-2.6%), Queensland (-3.7%), Victoria (-4.2%), the ACT (-4.4%), WA (-5.2%), and the NT (-8.0%). Only NSW (+2.1%) and SA (+5.8%) recorded a rise in trade credit applications.
The stabilising in the annual rate of decline in trade credit applications largely reflects movements in the main category of 30 day accounts (-1.7%), which has shown an improvement from an annual rate of decline of 4.7% in the previous quarter.
Growth in asset finance applications slowed significantly in the March quarter (+3.3%), following a strong December quarter (+8.8%). The deterioration in asset finance applications was seen across both the mining and non-mining jurisdictions in the March quarter.
The strongest growth in asset finance applications was recorded in NSW (+6.1%), followed by Victoria (+3.8%), the ACT (+2.8%), SA (+2.5%), and Tasmania (+2.4%). The mining jurisdictions saw weaker conditions for asset finance, with Queensland (+1.6%) showing weak positive growth, and WA (-2.3%) and the NT (-30.7%) experiencing falls.
Applications for hire purchase (-5.5%) and commercial rental (+0.3%) eased significantly in the March quarter and were the main drivers of the deterioration in asset finance applications growth overall. This was in contrast to growth in personal loans (+11.3%) and leasing (+10.3%), both of which remained strong.

NOTE TO EDITORS
The Veda Quarterly Business Credit Demand Index measures the volume of credit applications that go through the Veda Commercial Bureau by credit providers such as financial institutions and major corporations in Australia. Based on this it is a good measure of intentions to acquire credit by businesses. This differs to other market measures published by the RBA/ABS, which measure new and cumulative dollar amounts that are actually approved by financial institutions.
DISCLAIMER
Purpose of Veda media releases:
Veda Indices releases are intended as a contemporary contribution to data and commentary in relation to credit activity in the Australian economy. The information in this release is general in nature, is not intended to provide guidance or commentary as to Veda’s financial position and does not constitute legal, accounting or other financial advice. To the extent permitted by law, Veda provides no representations, undertakings or warranties concerning the accuracy, completeness or up-to-date nature of the information provided, and specifically excludes all liability or responsibility for any loss or damage arising out of reliance on information in this release including any consequential or indirect loss, loss of profit, loss of revenue or loss of business opportunity.
