Consumer credit demand moderate as credit card applications fall

Veda Quarterly Consumer Credit Demand Index: June 2016 quarter
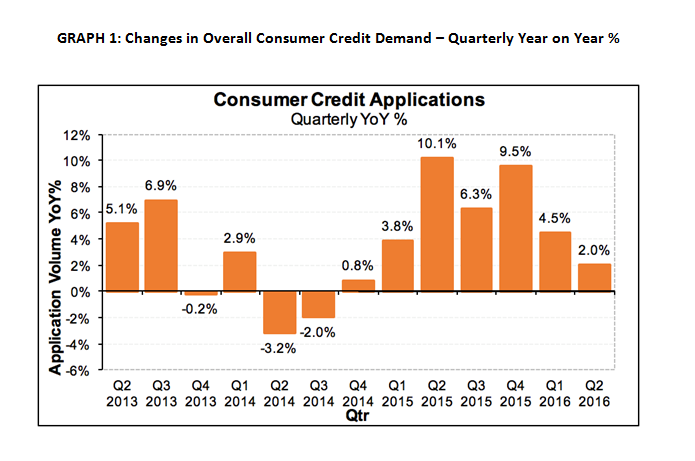
- Overall consumer credit applications up +2.0% (vs June quarter 2015)
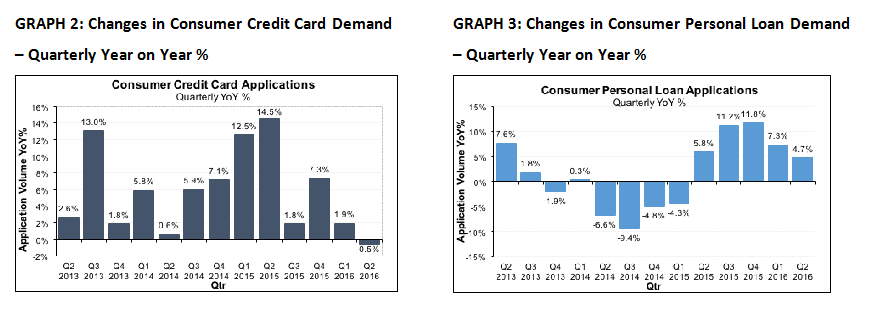
o Credit card applications declined by -0.5% (vs June quarter 2015)
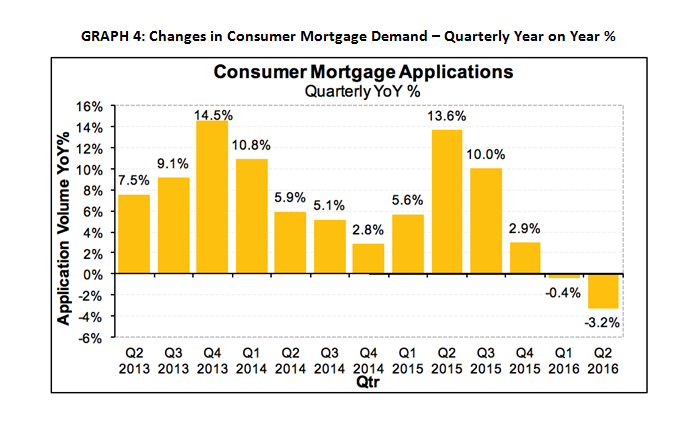
o Growth in personal loan applications slows to +4.7% (vs June quarter 2015) - Mortgage applications show a fall of -3.2% (vs June quarter 2015)
Sydney, Australia, Thursday, 14 July 2016: Veda, an Equifax Company, announced today the release of the Veda Quarterly Consumer Credit Demand Index, measuring the volume of credit card and personal loan applications, which rose at a moderate rate of 2.0% in the June quarter, compared with the same period in 2015.
The Index softened further in the June quarter, driven by the first fall in credit card applications since the March 2013 quarter.
In the June quarter, credit card applications experienced a decline of -0.5%, in contrast to the 1.9% growth seen in the March quarter. The annual growth rate of personal loan applications also slowed to 4.7%, down from 7.3% in the previous quarter.
The Veda Quarterly Consumer Credit Demand Index provides an early indication of movements in consumer spending and retail sales.
Angus Luffman, Veda’s General Manager of Consumer Risk, said that the continuing slowdown in residential property markets, coupled with weak wages growth and subdued retail sales growth, had all contributed to the continued slowdown seen in the June Credit Demand Index – which measures demand for discretionary consumer credit.
“The Credit Demand Index has continued a trend of softer growth throughout the quarter, with the exception of personal loan applications specific to the auto market - typically strong in the June quarter - which demonstrated good year-on-year growth,” Mr Luffman said.
“Turnover for household goods, which are often big-ticket items financed by credit, slowed significantly in recent months. The subdued outlook for the housing market, predicted by Veda’s mortgage demand index, suggests that the support provided by the housing market for retail spending will also decline.
“Further, the latest RBA data on credit cards shows consumers are continuing to use their credit cards more as a payment tool, rather than a credit instrument beyond interest free periods. The average transaction size for credit cards, which peaked in late 2008, is now back at levels not seen since 2004.
“Meanwhile, the average value of credit card repayments per account continues to exceed the average value of transactions by an ever-widening margin. These statistics further indicate that the Australian consumer remains circumspect about taking on additional discretionary credit,” he added.
Credit card applications contributing to the Index fell across the board in the June quarter (-0.5%). Declines in credit card demand were recorded in all states except Victoria, which experienced an annual growth rate of just 0.4%. NSW and the ACT recorded the smallest declines in credit card applications, both with a fall of 0.2%. This was followed by QLD (-0.9%), WA (-1.2%), the NT (-2.3%) and SA (-2.7%). Tasmania (-5.6%) recorded the largest fall in credit card applications in the June quarter.
Growth in personal loan applications eased in the June quarter. Tasmania (+9.5%) recorded the strongest growth in personal loan applications for the fourth consecutive quarter, followed by the NT (+6.2%). The annual growth rate of personal loan applications slowed in all other states and territories in the June quarter. Of these, the highest growth was in Queensland (+5.8%), followed by Victoria (+4.9%), NSW (+4.3%), SA (+3.1%), WA (+2.9%) and the ACT (+1.9%).
Demand for mortgages cooled again in the June quarter, experiencing a decline of -3.2%. This represents the fourth consecutive quarter of slowdown in mortgage applications, down from a high of 13.6% in the June quarter of 2015.
Mortgage applications fell in all states except the ACT and Victoria in the June quarter, where applications grew by 6.1% and 2.8% respectively. However, mortgage applications in Victoria have eased significantly, down from an annual growth rate of 14.5% experienced in the June 2015 quarter.
The sharpest decline in mortgage applications in the June quarter was in the NT (-14.3%), where mortgage applications have continued to decline since the December quarter 2014. WA (-12.1%), Tasmania (-11.5%) also saw significant falls, followed by NSW (-5.2%), Queensland (-3.3%) and SA (-0.7%).
Historically, movements in Veda mortgage applications have tended to lead movements in house prices by around six to nine months, with mortgage applications a good indicator of home buyer demand, and an excellent indicator of housing turnover.
“Regulatory driven changes to investor mortgages, implemented in the middle of last year have contributed to the cooling of mortgage demand over the past 12 months. The continuing weakness being seen in Veda’s mortgage applications data suggests the housing market will remain subdued for the foreseeable future,” Mr Luffman said.


NOTE TO EDITORS
The Veda Quarterly Consumer Credit Demand Index measures the volume of credit card and personal loan applications that go through the Veda Consumer Credit Bureau by financial services credit providers in Australia. Credit applications represent an intention by consumers to acquire credit and in turn spend; therefore the index is a lead indicator. This differs to other market measures published by the RBA which measure credit provided by financial institutions (i.e. balances outstanding).
DISCLAIMER
Purpose of Veda media releases: Veda Indices releases are intended as a contemporary contribution to data and commentary in relation to credit activity in the Australian economy. The information in this release is general in nature, is not intended to provide guidance or commentary as to Veda’s financial position and does not constitute legal, accounting or other financial advice. To the extent permitted by law, Veda provides no representations, undertakings or warranties concerning the accuracy, completeness or up-to-date nature of the information provided, and specifically excludes all liability or responsibility for any loss or damage arising out of reliance on information in this release including any consequential or indirect loss, loss of profit, loss of revenue or loss of business opportunity.
