Credit demand mixed with hunger for credit cards
Veda Quarterly Business Credit Demand Index: September 2014
Mortgage Demand moderating
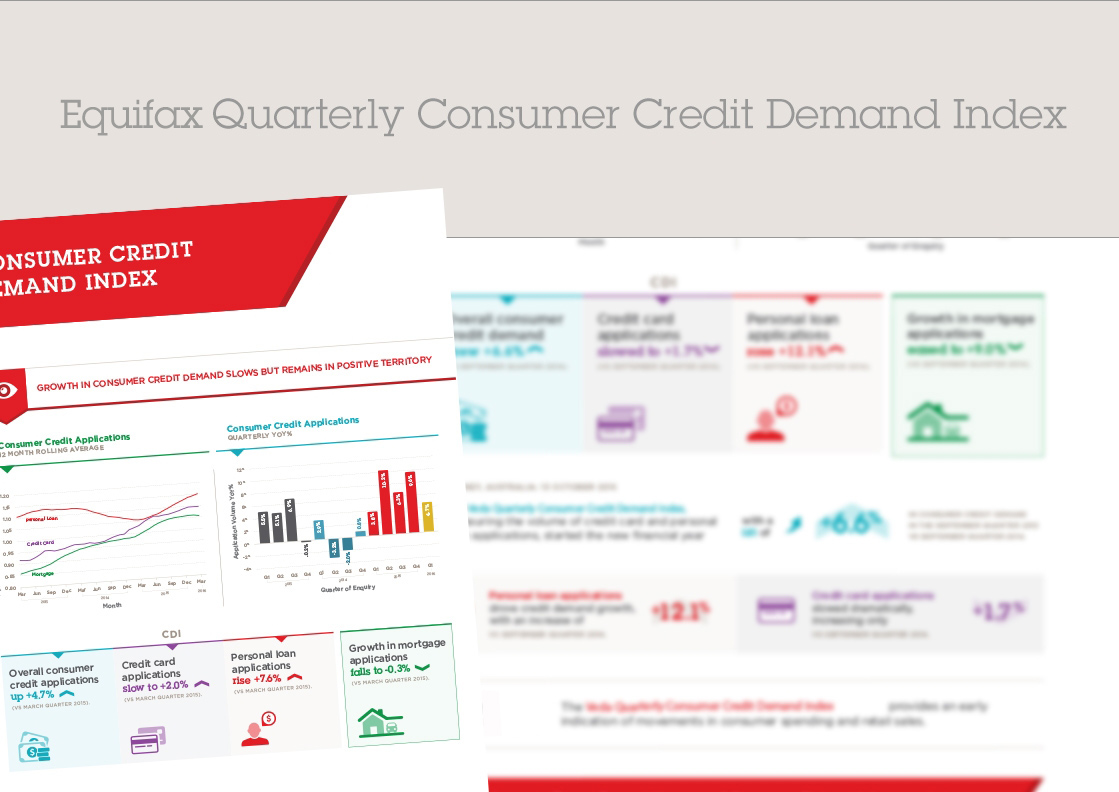
- Overall consumer credit demand eased to -1.8% (vs September quarter 2013)
- Credit card applications up 7% on September quarter 2013
- Personal loan applications fall 10% on September quarter 2013
- Growth in mortgage applications cools nationally to +5.1% (vs September quarter 2013)
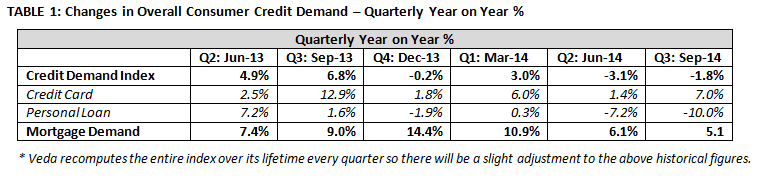
Sydney, Australia: 17 October 2014 – The Veda Quarterly Consumer Credit Demand Index, which measures the volume of credit card and personal loan applications processed at the Veda Consumer Credit Bureau versus the same period last year, eased to an annual rate of -1.8% in the September quarter.
A sharp jump in credit card applications, up 7% for the quarter, was offset by a 10% drop in personal loan applications. Overall credit demand was flat with a slight improvement (-1.8%) on the -3.1% growth recorded in the June quarter 2014 result.
Angus Luffman, Veda’s General Manager of Consumer Risk, said the lift in credit card applications was an encouraging sign for retailers in advance of the Christmas season.
“Application for a card does not necessarily mean the available credit will be drawn down immediately, but the potential for spending is there. Some of the demand has been fuelled by attractive offers in the market by card providers and the increase in use of cards as a payment option,” Mr Luffman said.
“We have now seen six consecutive quarters of growth for credit card applications, the longest period of growth since we have been publishing the Index.
“While Reserve Bank of Australia data for the 12 months to July 2014 showed growth in credit card accounts was only 0.7%, the value of credit card purchases and cash advances has been on a steady upward trend this calendar year. These trends would appear to support the recent strength in retail sales as we lead into the busy Christmas period.”
Mr Luffman said the 10% fall in personal loan applications in September quarter was influenced by falling car sales.
“The softening in personal loan demand has come after an extended run up in 2012-13. Car sales have fallen by 3.5% in the year to August 2014 which in turn reduces demand for personal loans. Wages growth has been weak, and with unemployment at 6%, consumers seem to have a relatively low appetite to take on new credit commitments for big ticket items.”
Released today, the Veda Quarterly Consumer Credit Demand Index provides an early indication of movements in consumer spending and retail sales.
Growth in credit card applications was 7% in the September quarter, up from 1.4% in the June 2014 quarter. Applications grew in all states except SA and the ACT. NSW (+5.8%), Victoria (+13.4%), Queensland (+7.8%), WA (+5%), Tasmania (+8.8%) and the NT (+8.3%) all saw growth. Credit card applications fell in SA (-6.7%) and the ACT (‑3.6%).
Nationally, personal loan applications fell sharply to -10% in the September quarter, following a -7.2% fall during the June quarter. Applications declined across all states: WA showed the largest fall (-15%) in applications, followed by the NT (-13.1%), NSW (‑11.6%), the ACT (-11.2%), SA (-8.4%), Victoria (-8.2%), Queensland (-7.6%) and Tasmania (-5.7%).
Growth in mortgage applications eased for the third quarter in a row, growing nationally at 5.1% in the September quarter.
Mortgage applications are not part of the Consumer Credit Demand Index, but are a good lead indicator of future activity in home buyer demand and housing turnover. Historically, movements in Veda mortgage demand have tended to lead movements in house prices by around six to nine months.
All states saw an easing in the growth rate of mortgage demand since late 2013.
While substantially down from its peak, mortgage enquiries were strongest in NSW (+8.4%), followed by Queensland (+6.9%), Tasmania (+6.9%), Victoria (+6.3%) and the NT (+3.2%). Mortgage applications have fallen over the past year in WA (-2.1%), SA (-3.1%) and the ACT (-4.5%).
After substantial growth that peaked around the new calendar year, mortgage demand continues to slow in the eastern states, compared to the highs reached late last year.
“What we saw as a lead indicator in the June quarter numbers is now becoming a trend. The housing market has well and truly cooled in WA and SA and is coming off the boil in the Eastern states,” Mr Luffman said.
“It is worth noting the impact of tougher economic conditions in SA and ACT. SA and ACT are the only state or territory to experience the treble of contraction in demand for credit cards, personal loans and mortgages in the September quarter.
“SA is feeling the impacts of a contraction in the manufacturing industry and rising unemployment, and the ACT appears to be feeling the impacts of cutbacks in Federal Government expenditure,” Mr Luffman said.
NOTE TO EDITORS
The Veda Quarterly Consumer Credit Demand Index measures the volume of credit card and personal loan applications that go through the Veda Consumer Credit Bureau by financial services credit providers in Australia. Credit applications represent an intention by consumers to acquire credit and in turn spend; therefore the index is a lead indicator. This differs to other market measures published by the RBA which measure credit provided by financial institutions (i.e. balances outstanding).
DISCLAIMER
Purpose of Veda Indices releases: Veda Indices releases are intended as a contemporary contribution to data and commentary in relation to credit activity in the Australian economy. The information in this release does not constitute legal, accounting or other professional financial advice. The information may change and Veda does not guarantee its currency, accuracy or completeness, and you should rely on your own analysis and enquiries. Veda has relied on third party information in compiling the Indices and has not been able to independently verify the accuracy of that information. To the extent permitted by law, Veda specifically excludes all liability or responsibility for any loss or damage arising out of reliance on information in this release and the data in this report, including any consequential or indirect loss, loss of profit, loss of revenue or loss of business opportunity.