Credit Demand trends show a mixed picture
Veda Quarterly Business Credit Demand Index: June 2014
Mortgage Demand continues to grow in eastern states
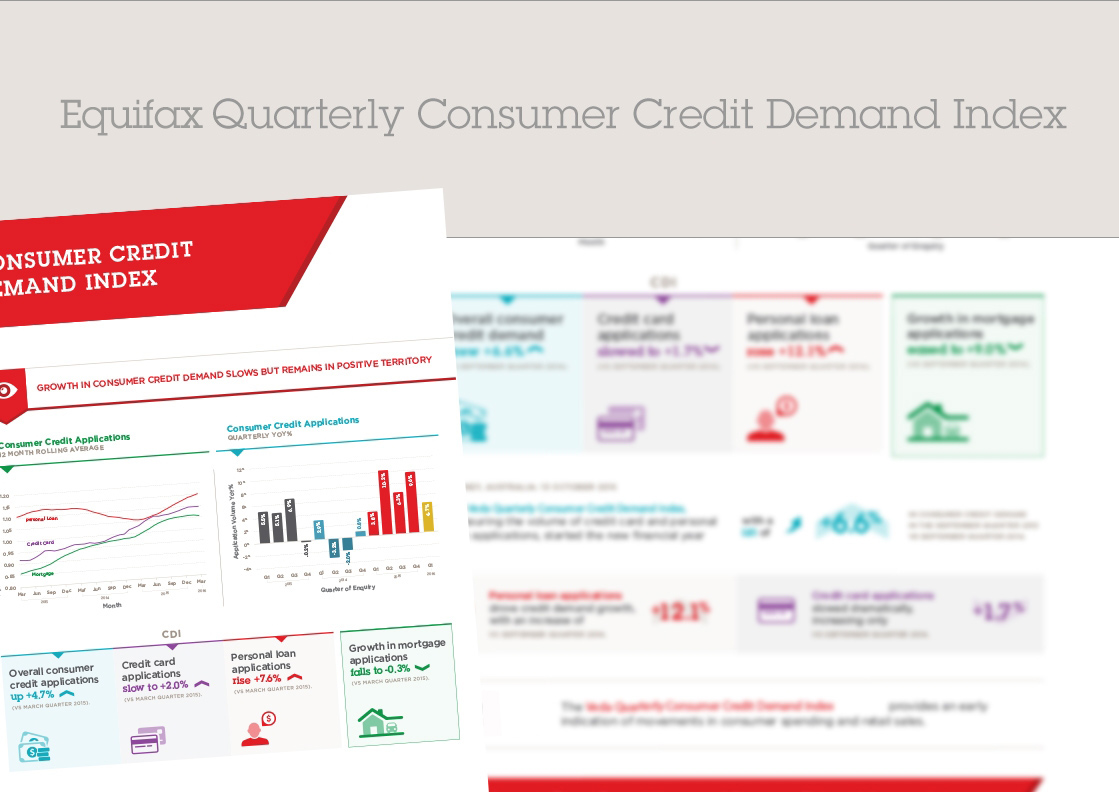
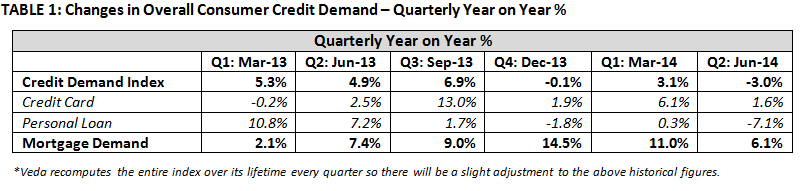
- Overall consumer credit demand eased to -3.0% (vs June quarter 2013)
- Credit card applications up by only 1.6% on June quarter 2013
- Personal loan applications fall -7.1% on June quarter 2013
- Growth in mortgage enquiries solid, but eases to 6.1% (vs June quarter 2013)
Sydney, Australia: 10 July 2014 – The Veda Quarterly Consumer Credit Demand Index, which measures the volume of credit card and personal loan applications that go through the Veda Consumer Credit Bureau, eased to an annual rate of -3.0% in the June quarter.
The downturn in the June quarter was driven by a sharp fall in personal loan applications as well as a moderation in growth of credit card applications. The significant slowdown in consumer credit demand follows a two year growth cycle which saw the strongest consumer credit demand since June 2008 recorded during the March 2014 quarter.
Released today, the Veda Quarterly Consumer Credit Demand Index provides an early indication of movements in consumer spending and retail sales.
Angus Luffman, Veda’s General Manager of Consumer Risk, said the softening of consumer credit demand in the June quarter was a result of a number of headwinds that have hit Australian consumers in recent months.
“The Federal Government’s May Budget took its toll on consumer confidence, while unusually warm weather has sapped autumn and winter sales for clothing retailers. Most fundamentally, income growth has been subdued against the backdrop of weakness in the labour market.
“These factors can be seen in Veda’s latest consumer credit demand data, which suggests a reduced appetite for consumer credit in the June quarter, and also suggests that retail sales in the June quarter are likely to have been soft,” Mr Luffman said.
Growth in credit card applications eased to 1.6% in the June quarter, down from 6.1% in the March 2014 quarter. Applications eased in all states except the NT (+15.6%) and WA (+2.8%), while Victoria (+7.4%), Queensland (+5.8%), and Tasmania (+2.7%) still saw positive growth. Credit card applications fell in NSW (-4.0%), SA (-4.3%), and the ACT (‑7.6%).
RBA data has also shown that growth in the number of credit card accounts fell to just 0.6% over the year to April 2014, the lowest growth on record. Growth in total credit card outstanding balances rose by 0.9% over the same period, increasing slightly since mid-2013.
Nationally, personal loan applications fell sharply to -7.1% during the June quarter, down from a rise of 0.3% recorded in the March 2014 quarter. Applications declined across all states; WA showed the largest fall (-10.6%) in applications, followed by the ACT (-10.3%), NT (‑8.7%), Victoria (-8.0%), Queensland (-7.3%), Tasmania (-6.3%), SA (-6.1%) and NSW (-5.0%).
“Car sales continue to contract and have fallen by 2% over the past year, which is reflected in the reduction of personal loan applications,” Mr Luffman said.
“Growth in the stock of other personal credit has continued its slight easing trend in recent months, consistent with slow personal loan growth.” Growth in both the RBA credit series are below historical standards.
Mortgage enquiries were solid during the June 2014 quarter, easing to 6.1%, according to Veda mortgage application data. Mortgage applications are not part of the Consumer Credit Demand Index, but are a good lead indicator of future activity in home buyer demand and housing turnover. Historically, movements in Veda mortgage demand have tended to lead movements in house prices by around six to nine months.
All states saw an easing in the growth rate of mortgage demand in the June quarter. Mortgage enquiries were strongest in NSW (+11.0%), followed by Tasmania (+10.4%), Queensland (+6.8%), and Victoria (+6.5%); while SA (-2.9%), WA (-0.2%), the NT (-0.1%), and the ACT (-5.2%) saw falls in mortgage enquiries to the June quarter.
After substantive growth that peaked around the new calendar year, mortgage demand continues to grow in the eastern states, but has come off the highs reached late last year.
“The growth in the stock of housing credit has continued to slowly pick up since early 2013, consistent with the earlier strength seen in mortgage enquiries. While it remains healthy in the main eastern seaboard states, with the rate of growth in mortgage applications now slowing, there are continuing indications that the pace of growth in the housing market is set to cool in the months ahead,” Mr Luffman said.
“Strong share market gains and higher housing prices continue to boost household wealth, while interest rates are at record lows, and these factors are providing some support to the overall consumer spending outlook.”
NOTE TO EDITORS
The Veda Quarterly Consumer Credit Demand Index measures the volume of credit card and personal loan applications that go through the Veda Consumer Credit Bureau by financial services credit providers in Australia. Credit applications represent an intention by consumers to acquire credit and in turn spend; therefore the index is a lead indicator. This differs to other market measures published by the RBA which measure credit provided by financial institutions (i.e. balances outstanding).
DISCLAIMER
Purpose of Veda Indices releases: Veda Indices releases are intended as a contemporary contribution to data and commentary in relation to credit activity in the Australian economy. The information in this release does not constitute legal, accounting or other professional financial advice. The information may change and Veda does not guarantee its currency, accuracy or completeness, and you should rely on your own analysis and enquiries. Veda has relied on third party information in compiling the Indices and has not been able to independently verify the accuracy of that information. To the extent permitted by law, Veda specifically excludes all liability or responsibility for any loss or damage arising out of reliance on information in this release and the data in this report, including any consequential or indirect loss, loss of profit, loss of revenue or loss of business opportunity.