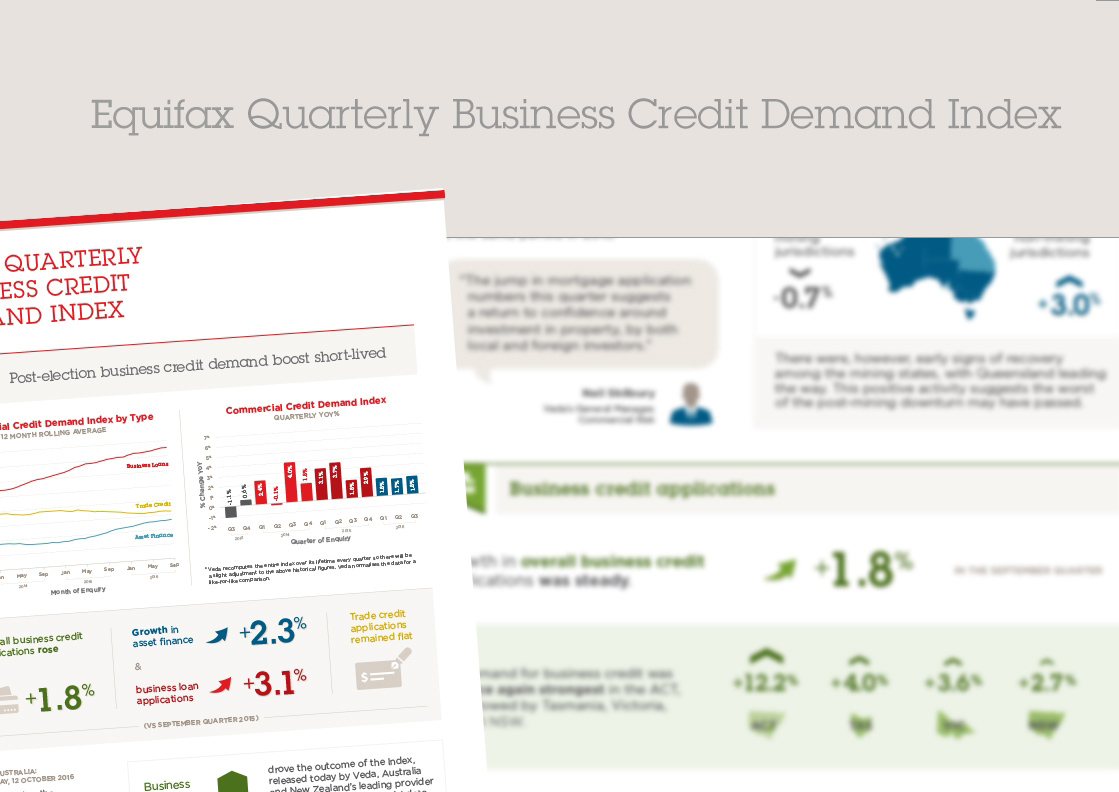
Equifax's Business Credit Demand Index - January to March 2011

Equifax's Business Credit Demand Index*, released today,reveals business credit enquiries have risen moderately (1.1%) since the same time last year, with the first monthly year-on-year gains since March 2010 occurring in February and March.
However, a dip in enquiries demand of 15.1% during January saw the quarter-on-quarter performance fall by 6.2% overall, potentially reflecting the impact of the holiday period, in line with seasonal expectations.
Combined business loans and credit cards recorded a year on year increase (3.8%) since March 2010 but are also down from the previous December quarter.
Asset finance showed refreshed signs of improvement, increasing 5.8% year-on-year, after a period of relatively lower levels following the drop in asset prices during the global downturn. Trade credit however, decreased 4.9%, compared to the same time last year (March 2010). Business utilities also recorded a sharp decline, -30.9%, since December 2010, but year-on-year differences remain relatively stable, up 1.8% since March last year.
Moses Samaha, Head of Commercial Risk at Veda said: "Whilst early days, the last two months indicate that the commercial market may be nearing an inflection point with a return of business confidence in some areas. This aligns with the steady economic recovery currently underway and contrasts with behaviour at the height of the global financial crisis when businesses were reluctant to take on credit due to more volatile market conditions."
However, he cautioned that the results also raise concerns over price escalation and rising overheads costs in the current economic climate, as it appears some SMEs are compelled to take on more credit to manage costs to meet business repayments.
Mr Samaha said a spike in insolvency statistics reveals a more concerning trend. Analysis by Veda Advantage on ASIC insolvency statistics shows the number of businesses registering as insolvent in March 2011 was the third highest insolvency on record (up 7.2% over March last year)**.
WA, VIC and QLD have all recorded an increase in insolvency activity in the first three months of 2011. Of the major states, only NSW did not record a rise in volumes (-0.6%).
"These figures are concerning and possibly reflect the lag effect present at the end of a financial crisis. They also highlight the need for better credit management practices to protect cash flow, particularly for SMEs and those still in the early years of operation," said Mr Samaha.
"Whilst recovery appears steady, as an increasing number of businesses decide to take on more credit, strong credit management practices will prove vital for business livelihood and longevity. This includes proactively managing financial assets and gaining a thorough understanding of the financial position of both the business as well as customers.
"Veda offers a number of on-file and investigative services to provide a business with the right information they need to ensure customers are still able to pay their debts," Mr Samaha said.
Detailed Busines Credit Demand Index results:
Across the states, Victoria recorded the largest year-on-year gain in overall business enquiries for the current quarter (4.8%), slightly down from March 2010 (5.2%). New South Wales (2.2%) and South Australia (1.7%) recorded the next largest gains.
Queensland and Western Australia recorded year-on-year decreases of -3.8% and -0.3% respectively. Compared to the previous quarter, Queensland (-6.8%) and South Australia (-7.4%) showed notable declines in credit demand.
Business Credit Demand YoY
- Business credit card demand showed the strongest year-on-year gains at 39.2%.
- Business loans were up 0.6% from March 2010, but down 8.0%from the previous December quarter.
- Combined loans and cards were up 3.8% year-on-year for March 2011.
- Asset finance increased 5.8% year-on-year, (up from 1.6% in March 2010).
- Trade credit was down 4.9% from March 2010 and business utilities were down from December 2010 (-30.9%), but year-on-year differences remain stable, up 1.8% since March last year.
State Differences
NSW recorded the highest proportion of credit enquiries at 32.2%. This was followed by VIC (27.4%), Qld (20.4%), WA (10.7%), SA (5.7%), TAS (1.5%), ACT (1.3%), NT (0.7%).
Source: Veda Business Database
- Ends-
For more information contact:
Sally Robertson 9492 1089 or 0400 927 003
About Veda www.veda.com. Veda has been at the forefront of the information services industry for many decades. Issues such as privacy, data security, fraud and business intelligence are part of our commercial landscape. We provide insights into more than 16.5 million credit active individuals and 4.4 million companies and businesses.
The Business Credit Demand Index looked at more than 7.2 million credit enquiries from 2004 to December 31, 2010 registered on Equifax's commercial database predominately from small and medium enterprises. Business CDI measures total Business Credit application activity over each quarter, comparing it with year on year analysis. Business CDI looks at all account types, including 30 day account, hire purchase, lending proposal, real property mortgage, leasing, commercial rental, communication services, credit card premium finance, seven day account, trade finance bill of sale overdraft, personal loan, utilities, cheque wholesale finance, cash on delivery factored account, 60 day account, continuing credit contract, 90 day account, bridging finance, deferred payment debit card.
DISCLAIMER
Purpose of Veda media releases:
Veda media releases are intended as a contemporary contribution to data and commentary in relation to credit activity in the Australian economy. The information in this release does not constitute legal, accounting or other professional financial advice. The information may change and Veda does not guarantee its currency or accuracy. To the extent permitted by law, Veda specifically excludes all liability or responsibility for any loss or damage arising out of reliance on information in this release and the data in this report, including any consequential or indirect loss, loss of profit, loss of revenue or loss of business opportunity.
